01Real sales rate, not a guess
Daily rate = half last 7 days + half last 30 days from actual orders (canceled and refunded excluded). When the shelf was nearly empty and the 90-day rate is clearly higher, sales were capped by stock — the rate is corrected from 90-day orders and marked.
02Lead time per supplier
Each supplier carries its own production and transit days (sea, air, land, express); defaults are editable. Pipeline = production + transit, and every SKU shows “production Xd + transit Yd + safety Zd”.
03Reorder point and stock-out date
Reorder point = daily rate × (pipeline + safety days); hero SKUs get a larger safety multiplier. Each SKU shows cover days, a “runs out” date and a suggested quantity rounded to your step and the supplier MOQ.
04Six clear alert levels
Out · Critical (stock + on way + open POs run out before a new order can arrive) · Reorder (below reorder point) · OK · Overstock (more than N days of cover) · No sales. Clearance SKUs are never reordered.
05Forecast that sees your marketing
Baseline demand = daily rate × trend (last 30 days vs the 30 before, damped) × KOL/content uplift (active creator deals and planned content linked to the SKU) × horizon, plus sale-day uplift and linked campaign days, minus stock, on-way and open POs.
06Sale days built in
Upcoming double days (11.11 and 12.12 strongest), mid-month and payday windows add only the uplift above a normal month, and are listed on the forecast so the team sees why a number is higher.
07AI reviews the baseline
One click sends the transparent baseline to a strong AI model: it returns its own quantity per SKU, a short reason and a risk tag (stock-out, overstock, data, spike), plus a summary that says whether anything needs air freight. Baseline and AI sit side by side; you choose.
08Cart → PO → approval → arrival
Add alerts or forecast lines to a cart, create POs grouped by supplier, submit for approval. Approval books the committed cost in the ledger and creates a “send PO” task with a checklist; arrival books the actual cost, notifies the warehouse and opens a receive-and-count task.
09Gantt timeline of every import
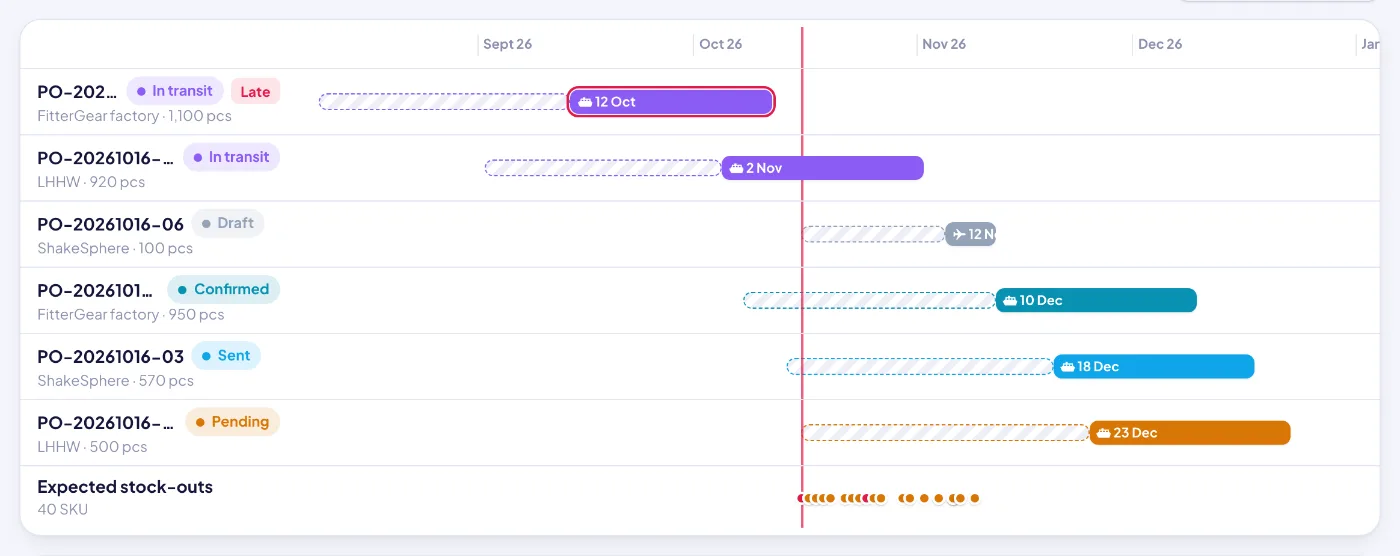
Each PO and import batch is a row: production bar to ETD, transit bar to ETA (ship or plane icon), estimated ETAs shown lighter, late POs flagged. A final row places every expected stock-out in the next 150 days on the same axis.
10Alerts that reach people
Hourly: a hero SKU that turns critical or out notifies leaders the same hour. Daily: one digest of every critical / out SKU, so nothing silently stays red.