In social commerce, content is the engine. Growth puts organic posts, creator videos, LINE broadcasts and campaigns side by side, so the team can see which content brings reach, which brings orders, and how fast the audience grows.
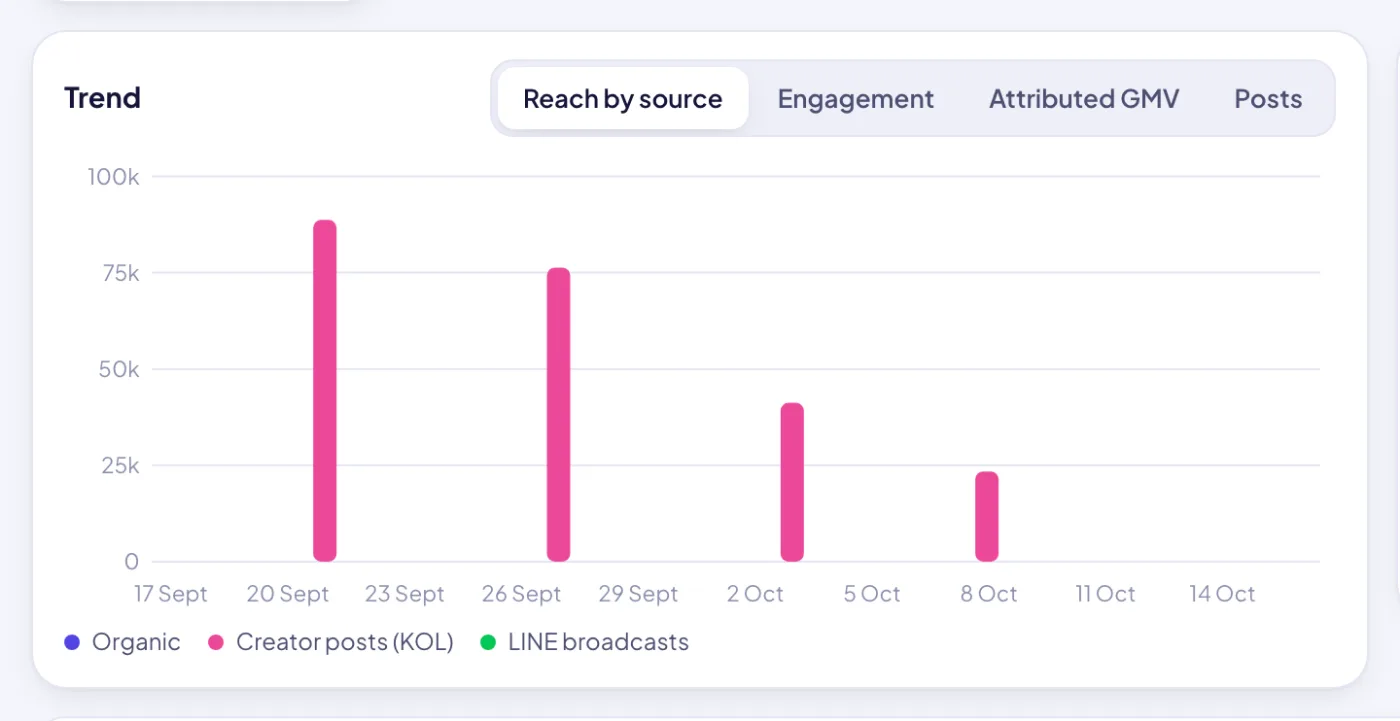
Reach by source, stacked: organic content, creator posts and LINE broadcasts, by day, week or month.
Highlights
Reach, engagement, followers and attributed sales from every content channel.
01
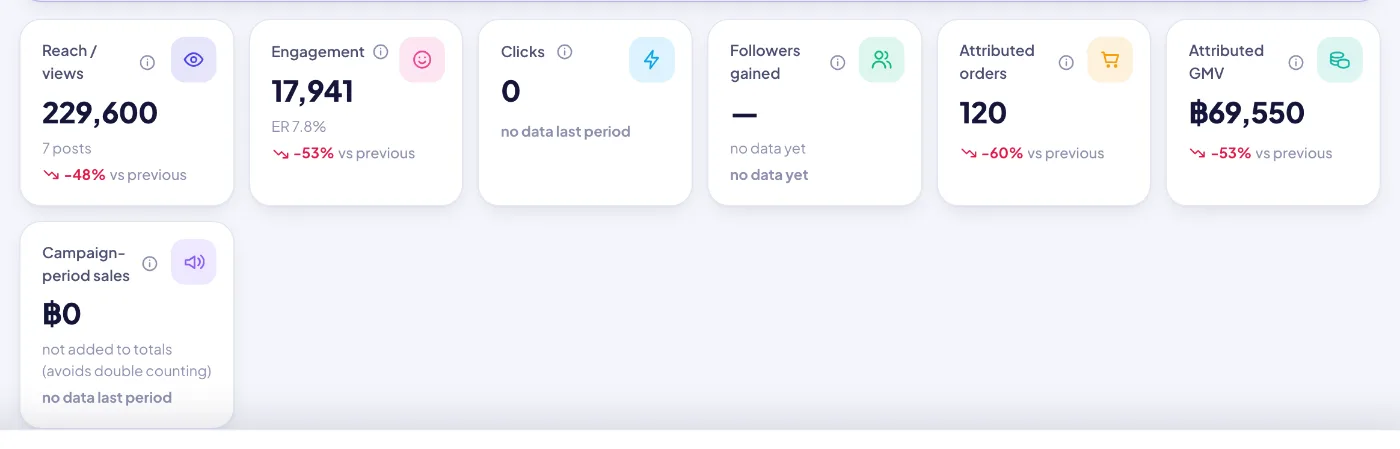
Seven KPIs, one baseline
Reach / views, engagement (with ER), clicks, followers gained, attributed orders, attributed GMV, and campaign-period sales. Every tile shows the change vs the previous period and has an (i) explaining the formula and source.
02
No double counting
Attributed GMV = content GMV + creator post GMV + LINE broadcast GMV. Campaign-period sales are shown separately and never added, because campaign orders already include them.
03
Followers gained per account
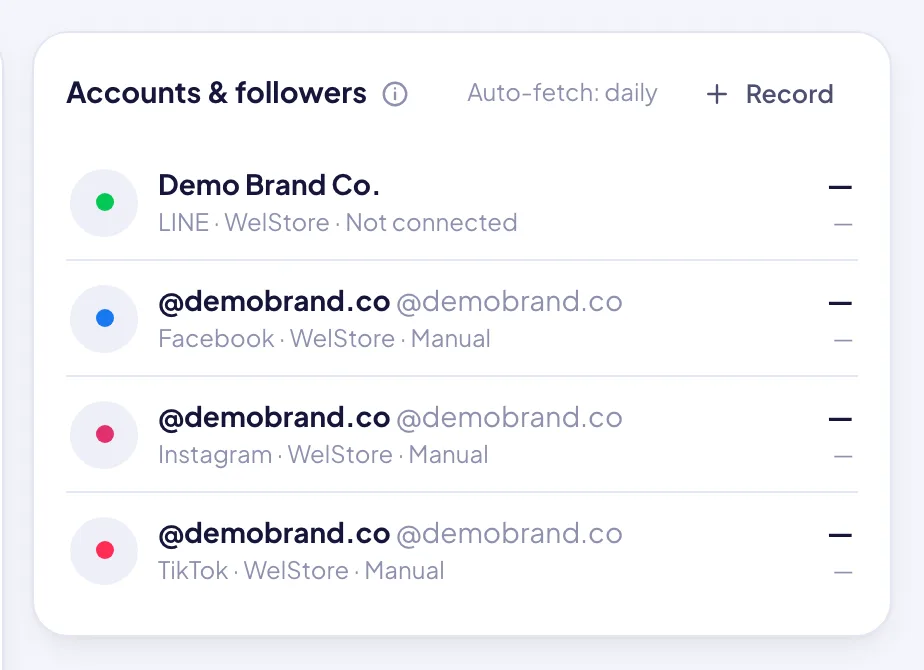
For each account, followers at the end − followers at the start of the period, then summed. Connected Facebook, Instagram, TikTok and LINE accounts are snapshotted daily (read-only). Accounts with fewer than two snapshots don’t count.
04
Auto-fetch first, manual only when needed
Auto-published posts pull views, likes, comments and shares every 6 hours, and follower counts are recorded daily. Connected accounts are locked against manual entry. Only unbound accounts can be recorded by hand.
05
Every number shows its source
Each account shows where its figure comes from: platform API, public profile, AI reading of the public profile, LINE sync or entered by hand. You can also see its status: connected, expired, manual or not connected.
06
LINE OA insights
Broadcast deliveries and unique clicks are read from LINE insight and can’t be edited. Orders and GMV from a broadcast can be added. Without insight, the numbers can be copied from LINE OA Manager.
07
Channel breakdown with ROI
One row per traffic source: organic per platform, creator posts, LINE broadcasts, campaigns. Columns cover posts, reach and share, ER, clicks and CTR, orders, GMV, spend, ROI / ROAS and cost per 1k views.
08
Leaderboards and what works
Rank content, creators, campaigns and LINE broadcasts. “What works” compares measured posts by content pillar, production type, platform and creator tier (avg views, ER).
09
Periods and brands
7, 15, 30, 90, 180 days, 1 year or a custom range up to 2 years. Charts switch to weekly beyond a month and to monthly beyond about six months. You can filter by brand from Brands & channels.
10
AI growth read-out
AI reads the period’s channel, content, creator, campaign and LINE numbers and says what grew, what worked best and what to do next.
The growth baseline: reach, engagement, clicks, followers gained, attributed orders and GMV, each compared with the previous period.
Traffic & growth
The growth baseline: reach, engagement, clicks, followers gained, attributed orders and GMV, each compared with the previous period.
Accounts & followers: each account’s followers, growth in the period and where the number came from.
Traffic & growth
Accounts & followers: each account’s followers, growth in the period and where the number came from.
Traffic & growth
How it works
1Connect accounts
Link Facebook, Instagram, TikTok and LINE OA once. A setup card shows exactly what is still missing.
2Publish and measure
Content, creator posts and broadcasts get their metrics fetched automatically, or entered where no API exists.
3Read the baseline
Compare reach, engagement, followers and attributed sales with the previous period.
4Double down
Use the leaderboards and “What works” to plan the next round of content and creators.
Traffic & growth
What each panel tells you
Reach / views
Views of content published in the period + creator post views + LINE broadcast deliveries.
Engagement · ER
Likes + comments + shares + saves on content and creator posts. ER = engagement ÷ views.
Clicks
Unique clicks of LINE broadcasts + link clicks recorded on content.
Followers gained
Per account: end − start of period, summed across accounts. Total followers shown underneath.
Attributed orders
Orders recorded on content + creator post orders + LINE broadcast orders that can be traced to that post or broadcast.
Attributed GMV
Content GMV + creator post GMV + LINE broadcast GMV.
Campaign-period sales
Order value of campaign SKUs within campaign dates overlapping the period. Shown separately, not added to totals.
Trend
Reach by source (stacked), engagement, attributed GMV or posts, by day, week or month.
By channel
Posts, reach, share, ER, clicks, CTR, orders, GMV, spend, ROI / ROAS per source.
Accounts & followers
Followers at the end of the period and growth per account, with the source and connection status.