
Buyer-paid GMV, not list price
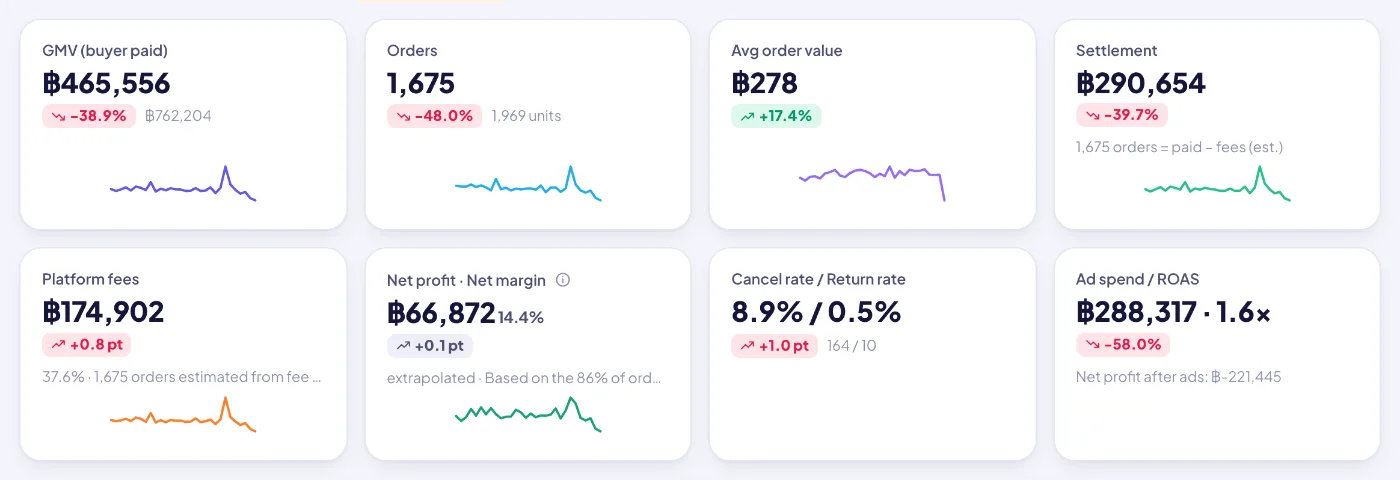
Sales are summed from what buyers actually paid on valid orders. Canceled, unpaid and returned orders are left out, and the average order value is GMV ÷ orders.
Content brings the traffic, marketplaces convert it, and the results end up scattered across Shopee, TikTok Shop, Lazada and your own store. The overview puts them on one screen: buyer-paid sales, fees, settlement and net profit, with the health checks that tell you what to act on next.
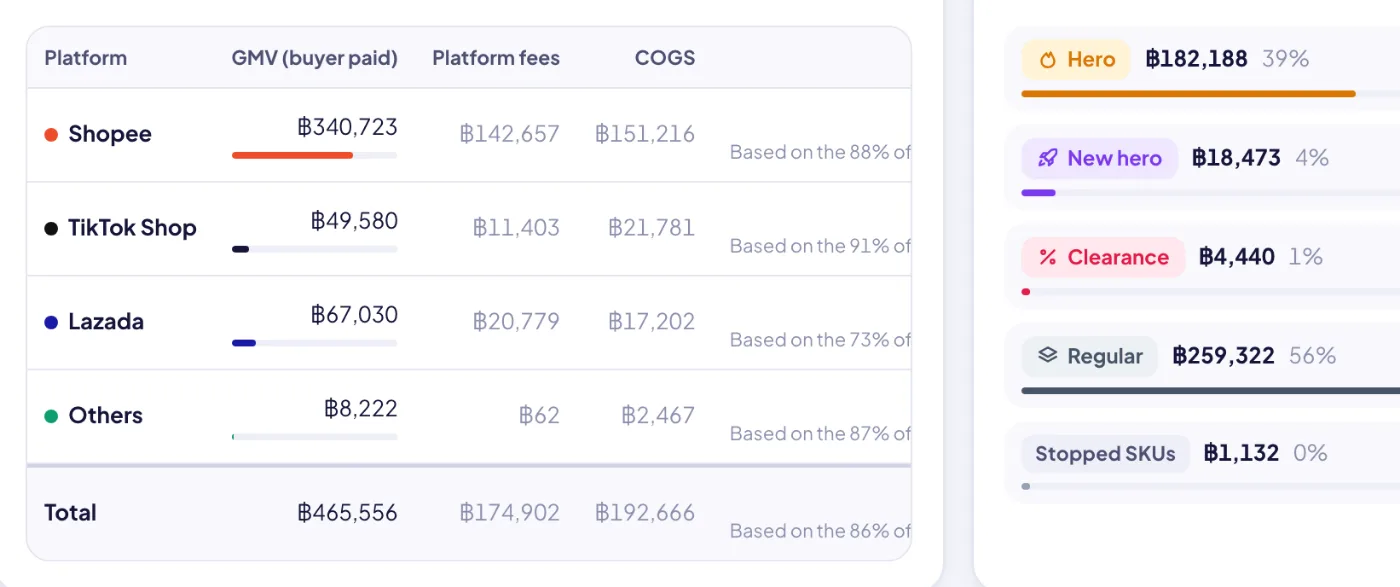
Sales are summed from what buyers actually paid on valid orders. Canceled, unpaid and returned orders are left out, and the average order value is GMV ÷ orders.
When an order carries its real platform fee or settlement amount, that number is used. When it doesn’t, the fee is estimated from your fee rules (rate + fixed fee per order), and the tile tells you how many orders were estimated.
Net profit = settlement − product cost. Margin is calculated only on orders whose cost is known, then extrapolated to all sales. The tile shows the coverage when it is below 98%, and every net figure has an “How is this calculated?” explainer.
One switch compares the range with the same number of days right before it. Each tile shows the change in % (or in points for rates). Rising fees and cancel rates are marked as bad.
Pick today, 7 or 30 days, month, quarter or year to date, or a custom range. You can filter by platform and by shop (shops grouped by brand). Clicking a platform in the donut, or a shop in the list, drills straight in.
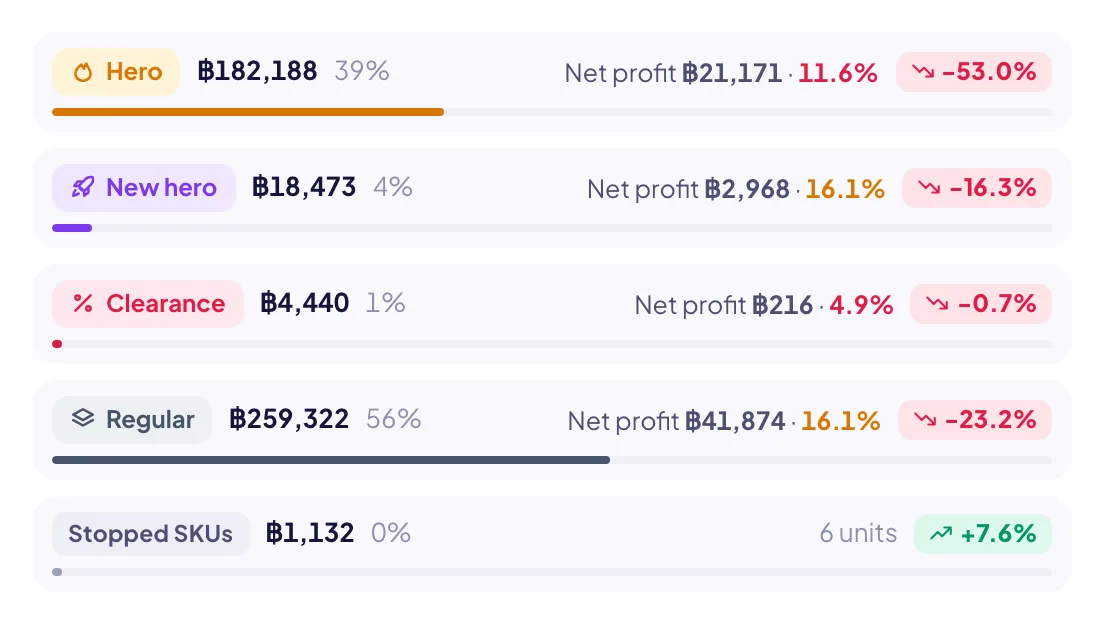
A matrix of sales by brand and by price tier (hero, new hero, regular, clearance, unmatched) shows where revenue really comes from.
Hero SKUs that are out of stock or have under 14 days of cover (with the quantity already on the way), SKUs below their net floor at list price, and SKUs below the floor at the price buyers actually paid in the last 30 days. Each row opens the SKU or its pricing.
If ad spend has been recorded (from the budget ledger or imported ad metrics), a tile adds spend, ROAS (GMV ÷ spend) and net profit after ads.
Product cost, net profit and margins only show to roles allowed to see cost. Everyone else sees sales, units, share and change vs the previous period.
One click asks the AI to read the numbers for the selected range, platform and shop and explain what moved and why. The answer can be copied or regenerated.
Orders arrive from direct shop APIs, an ERP bridge or imported files, already de-duplicated in the Data Center.
Choose the period, platform and shop, and turn on the comparison if you want it.
GMV → fees → settlement → product cost → net profit, by platform and by tier, against each tier’s floor.
Restock the hero SKUs that are running out, and reprice SKUs below their floor straight from the list.
Get a plain-language read-out of the period to share with the team.
Sign up free in a minute — you start on the Free plan and can upgrade any time. Bring your team, connect your shops and watch the numbers move.