
Traffic & growth — followers, reach and attributed sales
Traffic & growth is your team's growth baseline: reach, engagement, clicks, followers and orders from content, creators (KOL), campaigns and LINE broadcasts in one place. It reads numbers that other modules already collect and never posts anything to your social accounts.
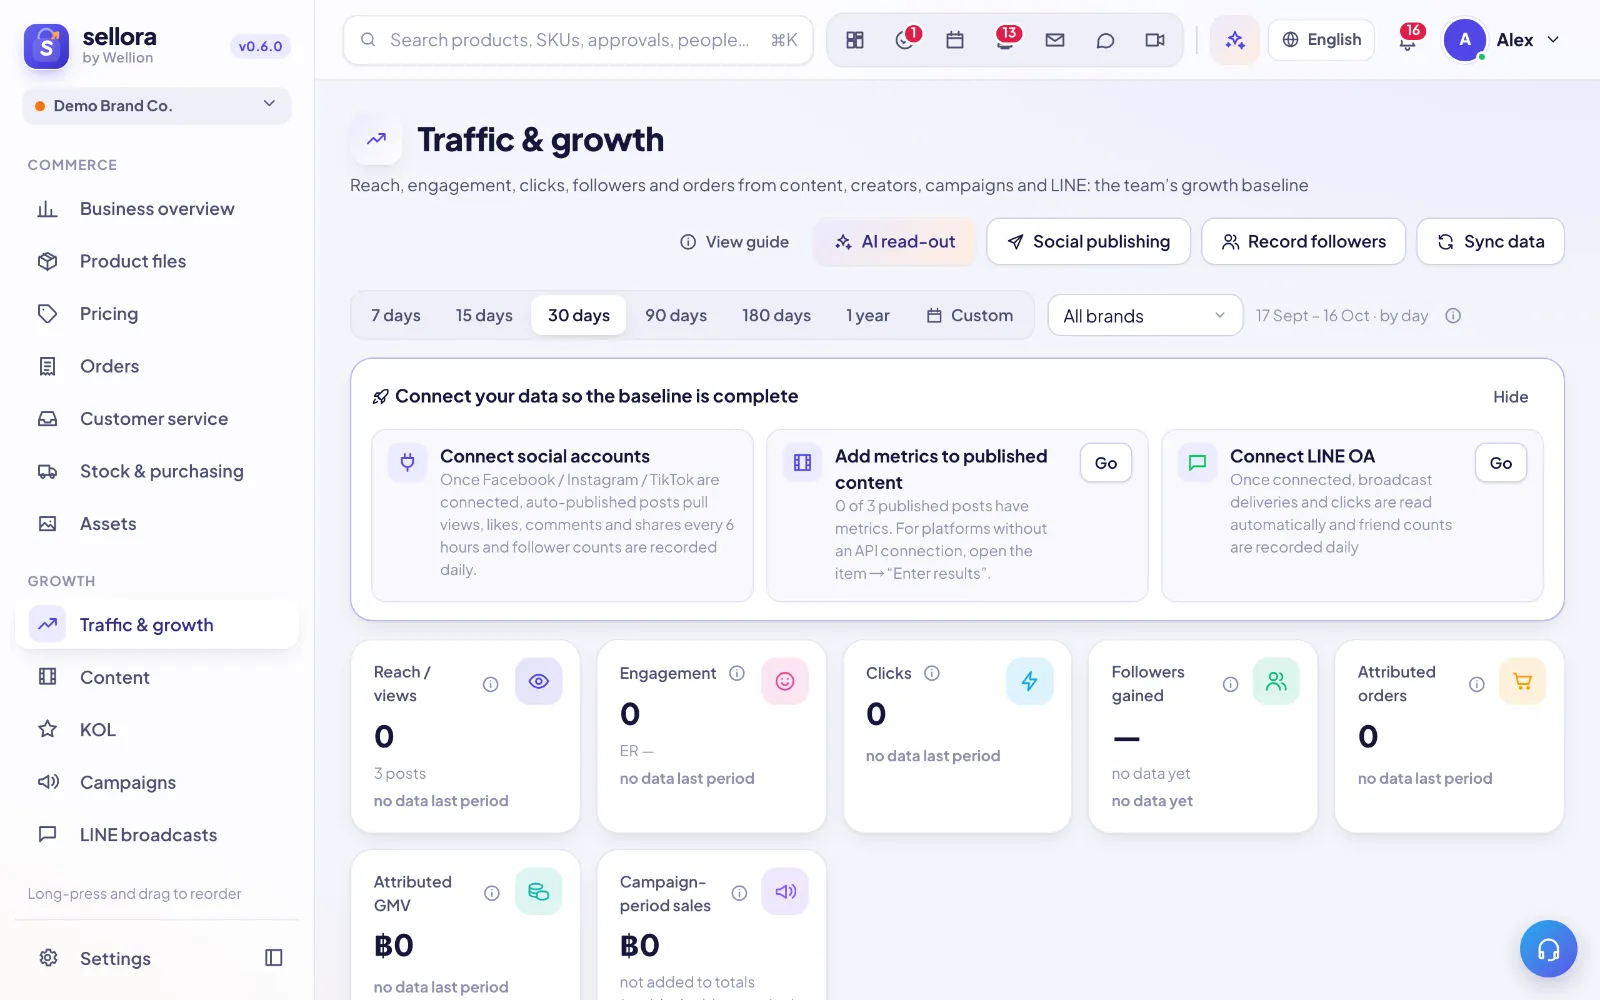
Choosing the period and brand
- Pick 7 days, 15 days, 30 days, 90 days, 180 days, 1 year, or Custom (From / To, then Apply; up to 2 years).
- Filter by brand with All brands. Brands and their social / sales channels come from Settings → Brands & channels; if none are set up you will see Set up brands.
- Each KPI is compared with the previous period of the same length (vs previous).
What the numbers mean
| KPI | How it is calculated |
|---|---|
| Reach / views | Views of content published in the period + views of creator posts + LINE broadcast deliveries. A post's lifetime views are counted on the day it was published. |
| Engagement | Likes + comments + shares + saves on content and creator posts. ER (engagement rate) = engagement ÷ views. |
| Clicks | Unique clicks on LINE broadcasts + link clicks recorded on content. |
| Followers gained | For each account: followers at the end − followers at the start of the period, then summed. Accounts with fewer than two records show no growth yet. |
| Attributed orders / Attributed GMV | Orders and sales that can be traced to a specific post, creator video or LINE broadcast. |
| Campaign-period sales | Sales of the campaign's SKUs during the campaign dates (the same figure as Campaigns → Results). Shown separately and not added to totals, because it already includes the orders above. |
Hover the info icon next to any KPI or section to see this explanation in the app.
How data gets in: bound accounts vs manual entry
Bound (connected) accounts are fetched automatically and read-only:
- Facebook, Instagram, TikTok — connect them in Content (Social publishing). Follower and post counts are recorded once a day; auto-published posts pull views, likes, comments and shares every 6 hours. If the platform API cannot return a number, SellerTiger reads the public profile instead (and, if your plan includes AI, uses AI to read it).
- LINE OA — once connected, friend counts are recorded daily, and for broadcasts sent in the last 14 days, delivered, opened and unique clicks are read from LINE insights.
- The frequency is set in Settings → Connections → Auto-fetch (daily by default). Press Sync data to fetch now.
Before accounts can be connected, an admin must enter the app keys (App ID / Secret) for that network in Settings → Connections.
Manual entry is for everything that is not bound:
- Record followers — choose an existing account or New account (manual), enter the account name, platform, brand, date and Followers (and optionally Posts). Bound accounts cannot be entered by hand — they are locked so the automatic numbers stay trustworthy.
- Content results — open a published item in Content → Enter results (views, likes, comments, shares, saves, clicks, orders, GMV).
- Creator posts — log videos and their stats in KOL → Posts.
- LINE broadcast results — in Leaderboards → LINE broadcasts, click Enter broadcast results on the broadcast's row. With LINE insights connected, Delivered and Unique clicks come from LINE and cannot be edited; you can still add Orders and GMV. Without it, copy the numbers from LINE OA Manager → Insight → Broadcasts.
The setup card at the top (Connect your data so the baseline is complete) shows what is still missing, such as how many published posts have no metrics.
Sections on the page
- Trend — reach by source, engagement, attributed GMV or posts, by day, week or month.
- Accounts & followers — each account's followers at the end of the period, growth (Gained), status (Connected, Expired, Manual, Not connected) and where the number came from (Platform API, Public profile, LINE sync, Entered by hand).
- By channel — one row per traffic source: Organic per platform, Creator posts (KOL), LINE broadcasts and Campaigns. Shows reach, share, engagement, ER, clicks, CTR, orders, GMV, spend and ROI. KOL spend = commission + fees; campaign spend = ledger actuals + ads (budget used as an estimate when nothing is recorded).
- Leaderboards — top Content, Creators, Campaigns and LINE broadcasts. Click a row to open it.
- What works — average views and ER grouped by content pillar, production type, platform and creator tier. Uses measured posts only; groups with fewer than 3 posts are only indicative.
AI read-out
Press AI read-out → Write the read-out. AI reads this period's channel, content, creator, campaign and LINE numbers and tells you what grew, what works best and what to do next.
Tips and FAQ
- Followers gained shows nothing. An account needs at least two records in the period. Connect it, or record followers by hand at the start and end of each month.
- An account shows Expired. Reconnect it in Content → Social publishing; until then, numbers stop updating.
- Why can't I type followers for my Instagram account? It is bound, so it is fetched automatically every day.
- Some sections are hidden. You only see parts for modules you can view (Content, KOL, Campaigns, LINE).
Tip: Enter results for every published post — even rough numbers — so What works has enough data to compare.
Inside SellerTiger, press the headset button to ask the AI assistant or open a support ticket.